Benchmark report
Autonomous Research on Low Signal-To-Noise Datasets
Measuring agents’ capabilities in quantitative research
Can an AI agent work like a real-world researcher? Can it independently do an end-to-end research process on low signal-to-noise datasets? To this end, Alpha Autoresearch evaluates the ability of agents to generate predictive signals (alpha) from noisy market data. Frontier agents are provided with datasets, research tools, verifiers, and a clearly defined goal: build models to predict market returns and turn the predictions into profitable strategies.
A goal-oriented real-world research benchmark
Alpha Autoresearch uses real-world financial datasets and realistic research constraints rather than synthetic problems. Agents receive a workspace modeled on the research environment of a quantitative researcher at a hedge fund such as Citadel. Given these datasets, the agent’s goal is to build predictive features and machine learning models and deliver a profitable trading strategy. We use quantitative research for evaluation because it is an economically valuable and technically challenging area of machine learning research.
The benchmark has three defining characteristics:
- An open-ended research goal: The agent chooses which questions to investigate, forms hypotheses, designs experiments, and decides when to iterate, pivot, or stop.
- Real-world, low signal-to-noise datasets: Agents work with real-world, low signal-to-noise financial market datasets, a challenge for both human researchers and frontier agents.
- Multiple evaluation perspectives: The verifier measures both prediction quality and the economic performance of the resulting trading strategy, providing complementary views of agent performance.
These characteristics distinguish Alpha Autoresearch from many existing research and engineering benchmarks. Benchmarks such as PaperBench and RE-Bench give agents a defined project to reproduce or reimplement. MLE-bench evaluates predictions against fixed labels. Alpha Autoresearch instead leaves the research path open and evaluates both the predictions and the economic value of the trading strategy.
Benchmark Setup
Alpha Autoresearch gives each agent a realistic quantitative research environment. Agents are free to run any experiment and fit an Elastic Net model with L1 and L2 regularization. In addition, they can access a backtesting engine that converts predictions into a trading strategy and measures its performance on historical data after execution costs. The backtesting engine serves as an accessible verifier.
The public data are anonymized. Calendar dates, symbol names, and the target name are masked. The future return target is also transformed. This reduces the risk of lookahead caused by information learned during model pretraining and ensures that research decisions are based on the data and experimental results available during the rollout.
Evaluation protocol
At the end of each rollout, the agent submits an executable model. It also selects the strategy’s maximum risk exposure, which limits the strategy’s absolute position size. The verifier runs the model on a hidden out-of-sample dataset and evaluates both its predictions and the resulting trading strategy using the following metrics:
- Prediction quality: Pearson IC, , where is the model prediction and is the ground-truth target.
- Strategy performance: PnL, maximum drawdown, and Sharpe ratio.
- PnL: The cumulative return generated by the strategy.
- Maximum drawdown: The largest peak-to-trough loss.
- Sharpe ratio: The return relative to risk, calculated as , where represents strategy returns.
Data
The benchmark uses anonymized minute-level market data from four cryptocurrencies. Agents receive raw market inputs and example features for research. They develop their models on the public dataset, while the verifier evaluates final submissions on a hidden out-of-sample dataset.
- Symbols: BTC, ETH, SOL, and DOGE, each anonymized to a generic identifier.
- Raw inputs: Open, high, low, and close prices; volume; and trade-flow measurements for each minute.
- Public dataset: January 1, 2022–December 31, 2023, with roughly 4.2 million samples.
- Evaluation dataset: January 1–December 31, 2024, with roughly 2.1 million samples.
- Timestamp anonymization: Timestamps retain their original granularity but are shifted to begin on January 1, 1980.
To verify that the public dataset contains predictive signals, we handcrafted a linear model with 20 features using only the public development data. When evaluated by the verifier on the out-of-sample dataset, it achieved roughly 3% IC and a Sharpe of 1.15 after costs, which is economically meaningful. These results suggest that the public data contains sufficient signal and that the benchmark is feasible for the agents.
Agent environment
Every rollout uses the Kimi Code harness with its system prompts replaced by our custom research prompts. We hold the harness fixed so that the benchmark reflects the capabilities of the agents. Agents also have access to environment-specific MCP tools for model training, backtesting, and retrieving fit diagnostics and backtest results. All agents are run with the highest thinking effort.
Benchmark results
All scores below are measured on the hidden 2024 evaluation dataset and aggregated for each frontier model family. Pearson IC measures statistical generalization. Sharpe and PnL measure strategy performance, while maximum drawdown measures the strategy’s largest peak-to-trough loss. All three strategy metrics are computed after applying execution costs of 0.01%.
Model comparison
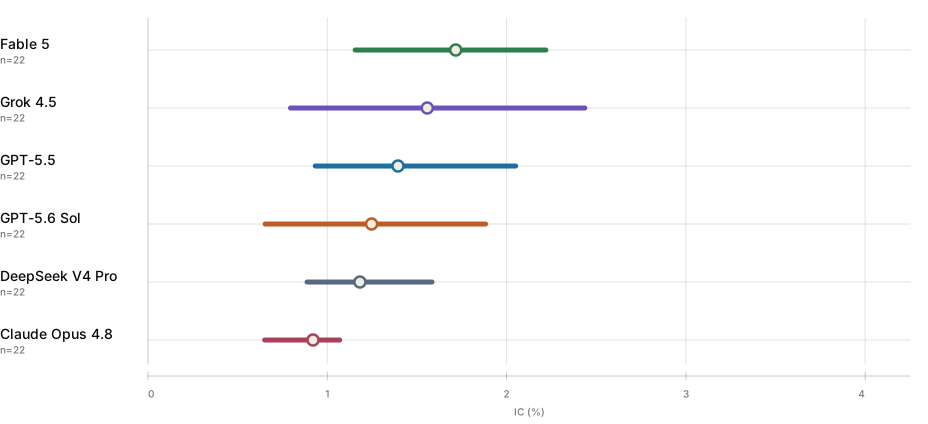
The thick line spans the 20th–80th percentile range across all scored rollouts. Models are ranked separately in each metric by their aggregated mean.
Fable 5 and Grok 4.5 produced the strongest overall results. Fable achieved the highest mean IC and Sharpe, while Grok produced the highest mean PnL after costs and the lowest mean maximum drawdown. For the remaining frontier models, prediction scores were generally weaker, and the resulting edge was often too small to survive execution costs.
Performance also varied substantially. The same agent could produce a model with meaningful predictive and economic value in one rollout, then produce an approximately flat or losing strategy in another. Much of this variation appears to depend on feature discovery. When a rollout identified a genuinely useful feature and incorporated it effectively, performance could improve sharply. When the search settled on weak features, the final strategy usually produced little economic value. Average scores therefore combine a small number of strong outcomes with many unsuccessful rollouts. Frontier agents can occasionally produce economically meaningful predictive models, though they do not yet do so reliably.
Tokens and cost efficiency
Performance scores alone hide what an agent spends to get there. Tokens and cost efficiency matter in real-world applications. We therefore track and plot token consumption and cost alongside performance. The plots below compare each model family’s average token consumption and average cost with its average score on each benchmark metric.
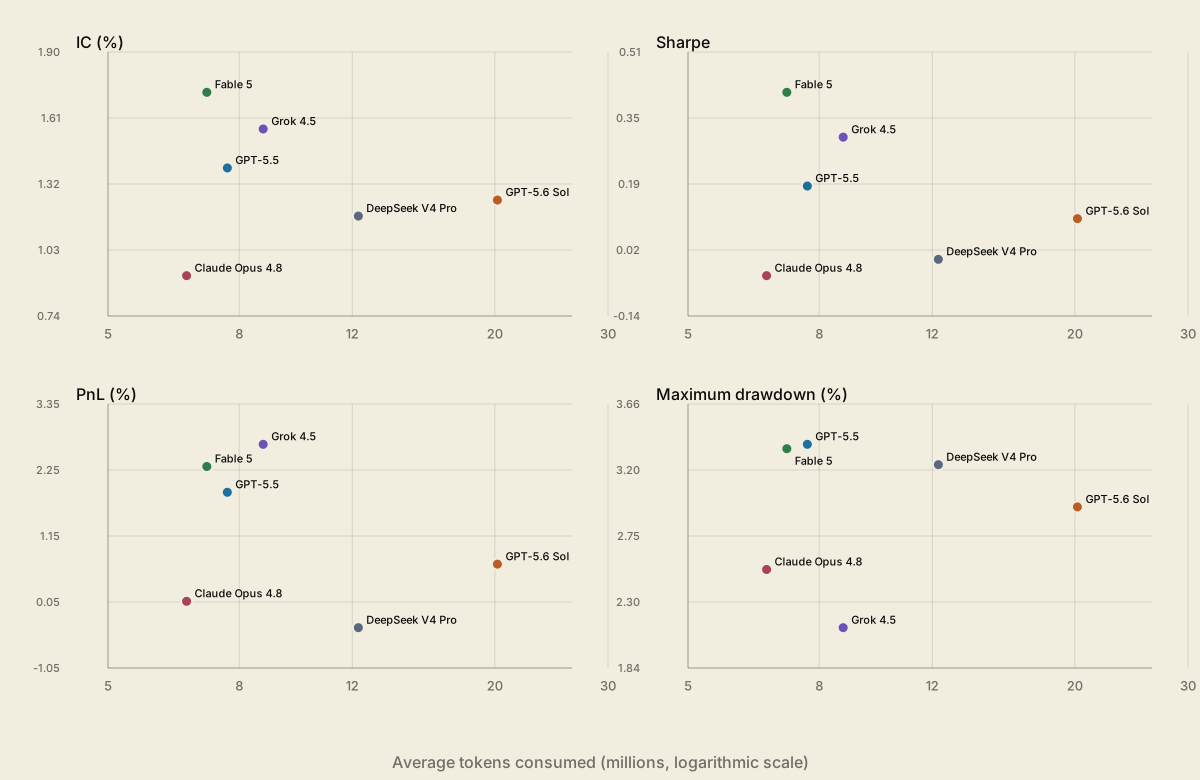
Efficiency varied substantially across agents, but agents from the same frontier model family also tended to use similar amounts of tokens and incur similar costs. Fable achieved strong performance on nearly all metrics with relatively few tokens, but its higher per-token price made it expensive. Grok, by contrast, combined strong performance with low token usage and cost.
Qualitative analysis
Research trace: how Fable researched a feature end-to-end
Alpha Autoresearch keeps traces of all research experiments conducted by the agents. To illustrate an end-to-end research process, we present one feature engineering trace from a Fable rollout. In this example, Fable investigated whether sharp price reversals within a minute could help predict the next market move.
01 — Hypothesis
Fable formulated a hypothesis around price reversals from minute-level candle data.
Each minute of market data is summarized as a candle using four prices: the opening, highest, lowest, and closing prices. An upward price reversal occurs when the highest price is substantially above both the opening and closing prices. A downward price reversal occurs when the lowest price is substantially below both. Fable hypothesized that the direction and size of these reversals could contain information about the next market move.
02 — Feature candidates
Fable translated the hypothesis into two price reversal features.
Fable normalized the upward and downward price reversals by the candle’s full price range: and .
Both features range from zero to one. A larger value represents a larger price reversal within the minute.
03 — Evidence collection
Fable measured IC across chronological validation folds.
Across four chronological validation folds, Fable measured the IC of each feature against the future return target.
| Feature | Fold 1 | Fold 2 | Fold 3 | Fold 4 |
|---|---|---|---|---|
| Upward reversal | −0.0046 | −0.0034 | −0.0027 | −0.0023 |
| Downward reversal | +0.0020 | +0.0031 | +0.0051 | +0.0008 |
The directions matched the hypothesis: larger upward reversals were followed by lower returns, while larger downward reversals were followed by higher returns. The correlations were consistent in direction but small in magnitude.
04 — Ablation study
Fable tested whether the price reversal features improved the fitted model.
The price reversal features were weakly correlated with the other features in the fitted Elastic Net model. To decide whether they should be included, Fable ran an ablation study on two validation folds. After removing the price reversal features, performance was unchanged on one validation fold, while IC on the other improved from 0.00676 to 0.00739.
05 — Decision
Fable removed the features from the model.
Fable concluded from these observations that the signals were too weak and were already captured by the existing feature set. In the end, Fable decided to abandon them.
What are the common failure patterns in the rollouts?
Overall, frontier agents performed poorly on the Alpha Autoresearch benchmark. To understand where the research process broke down, we analyzed the preserved trajectories from the rollouts. The agents generated many hypotheses and ran large numbers of experiments. Their main difficulties lay in how they interpreted the evidence and decided what to keep. Across agent families, three failure patterns recurred consistently.
01 — Reusing a small validation set too many times
Agents often selected a very short validation period, sometimes only one month of data, and reused it throughout the research process. They evaluated many feature ideas and model parameters on the same validation set, then used those results to decide which experiments to run next and which features and parameters to keep. Validation results based on very few samples are not statistically significant in market datasets with low signal-to-noise ratios. After enough iterations, the validation period no longer provided an independent test and effectively became part of the model selection process, causing the agents to overfit to it.
How often agents reused the same validation month
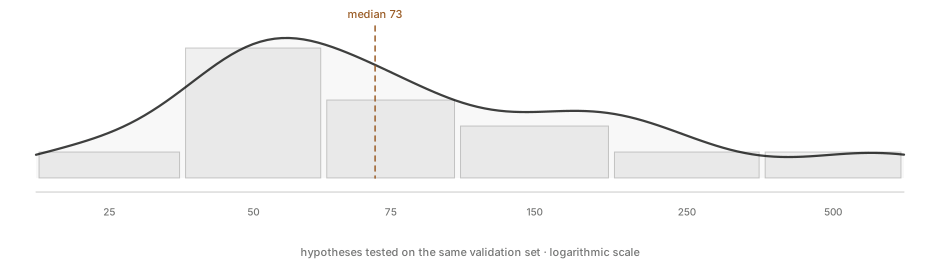
For each rollout, we identified the most frequently used validation month and counted how many hypotheses, feature selections, and parameter settings were evaluated using only that month. The number below each bar represents the reuse count for that group. The horizontal scale is logarithmic.
An example
One GPT-5.6 Sol rollout pushed this behavior much further: 1,494 local fits were spread across only three validation months, with 498 fits on each. The final submission scored 3.4303% IC in its selected validation month during development but 0.4767% IC in the hidden dataset during final evaluation.
02 — Iterating on too few research hypotheses
We observed that agents tended to conduct broad rather than deep research. To quantify this pattern, we grouped experiments that tested the same underlying hypothesis into a single research group. Alternative transformations, hypothesis refinements, and ablation studies were counted as iterative attempts within the same group. For each rollout, we then measured the share of research groups that contained an iterative follow-up. We used the ratio of groups with follow-ups to the total number of groups in a rollout as an estimate of its research depth.
The chart below illustrates the research depth of each frontier model family. Fable showed the greatest depth, with a mean ratio of 32.6%. GPT-5.6 Sol followed at 24.2%, while DeepSeek V4 averaged 8.8%. The ranges show that depth varied substantially across agents and rollouts.
Mean percentage of research groups that received a follow-up
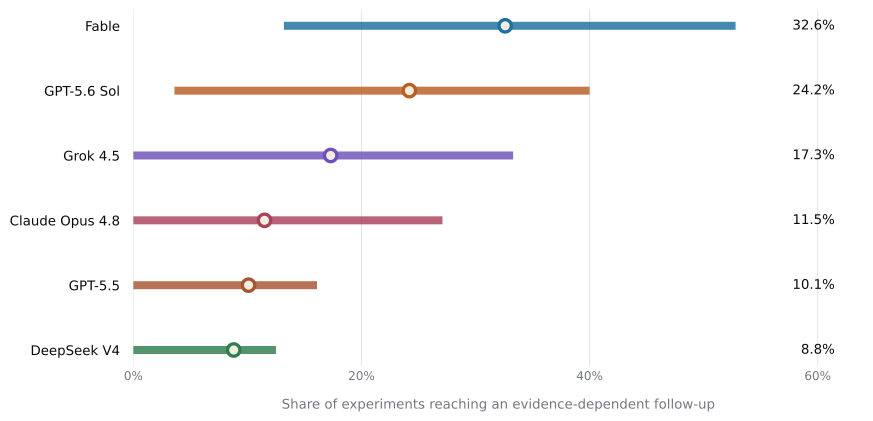
Dots show the mean across rollouts; lines show the interquartile range. A research group counts as iterative only when it contains follow-ups to the same hypothesis.
What counts as iterative research?
Iterative research begins only after an initial experiment receives follow-ups based on evidence from the same hypothesis. These follow-ups may revise the construction, test a conditional version, examine robustness, or ablate the feature inside a model. Several agents demonstrated this behavior, though it remained concentrated in a small subset of the groups they explored.
03 — Keeping features without testing their incremental value
A feature can correlate with the target by itself and still add no value once other features are present because the existing predictive model already captures the same signal. Adding too many features that capture the same market signal can make the model harder to fit. An ablation study is therefore needed to determine the incremental value of a feature.
During feature engineering, agents often stopped after finding that a new feature had a positive IC with the target and a low correlation with the existing features. Neither result can replace an ablation study.
Research diversity within and across rollouts
Research progresses when independent ideas explore different paths. Diversity brings different ways to frame the problem, different hypotheses to test, and more chances to discover something new. In Alpha Autoresearch, we estimate diversity from how much agents’ outputs vary within and across rollouts by comparing correlations among the features and predictions they generate.
- Within-rollout diversity: We compute correlations among features tested by different research experiments in the same rollout. These correlations quantify the diversity of ideas and attempts within a single end-to-end research process.
- Across-rollout diversity: We compute correlations among features and predictions produced by the final submissions of different rollouts. These correlations quantify the diversity of the final submitted predictive models.
Feature correlations within and across rollouts
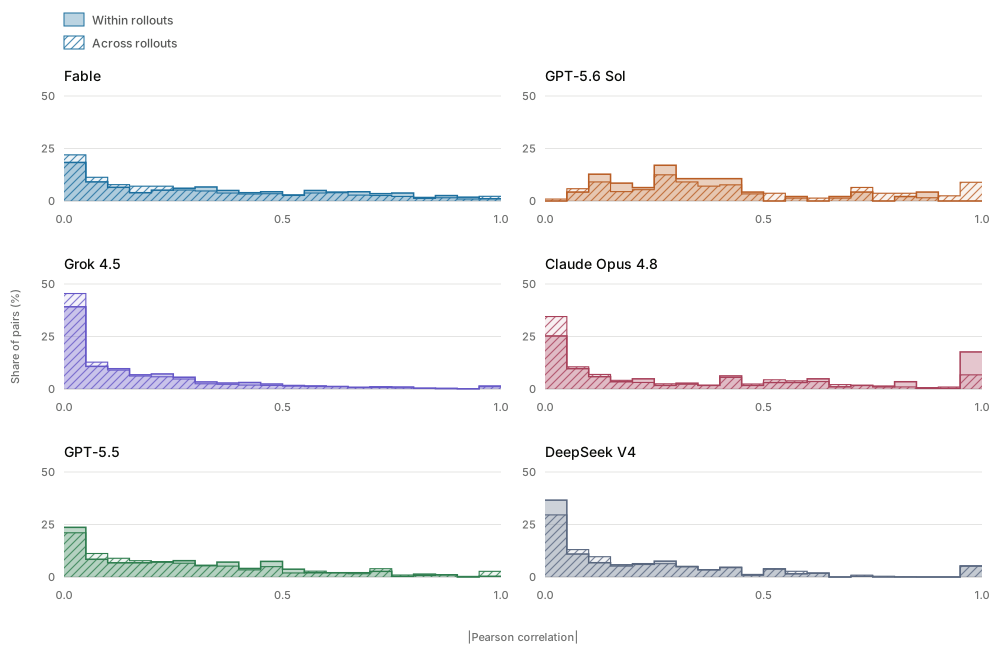
Each panel shows the absolute Pearson correlation distributions for feature pairs from one model family. Both histograms use the model family’s color. The solid fill represents pairs within the same rollout, while diagonal hatching represents pairs across different rollouts.
Feature diversity varied substantially across agents. However, for every frontier agent, its intra-rollout feature correlation distribution was surprisingly similar to its across-rollout distribution. The failure diagnostics in the previous section suggest one possible interpretation: agents researched broadly rather than iteratively and deeply. They therefore assembled collections of largely independent ideas and hypotheses, both within and across rollouts.
Prediction correlations across rollouts
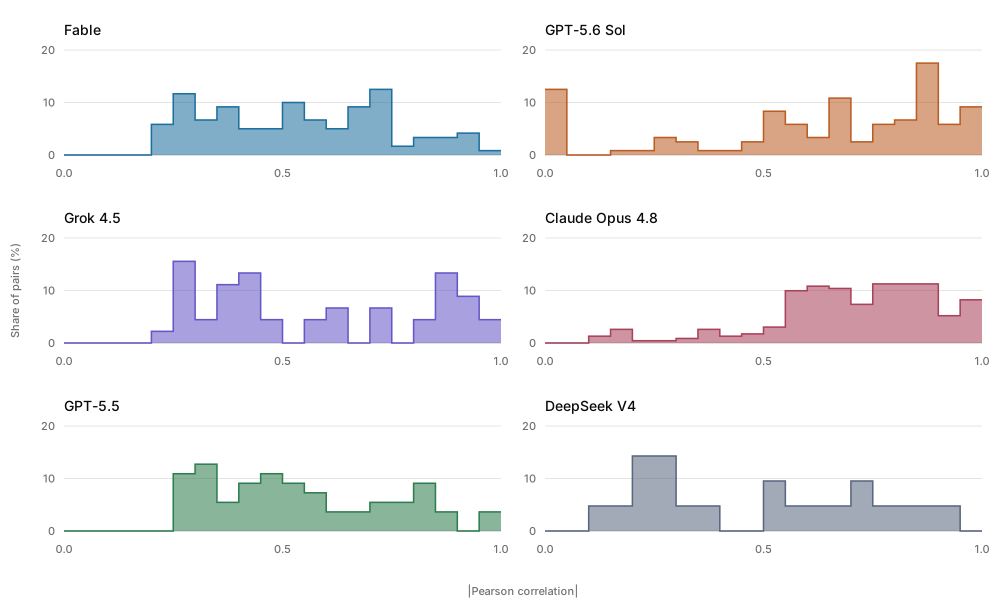
Each panel shows the absolute Pearson correlation distribution for prediction series across rollouts within one model family. Each distribution is normalized to the percentage of pairs in each bin. All prediction series use the same out-of-sample evaluation dataset.
Some of this variation in feature construction disappeared during model fitting. GPT-5.6 Sol and Claude Opus 4.8 produced the most similar predictions across rollouts. Their distinct collections of features converged to similar fitted models. On the other hand, DeepSeek V4 produced the most varied predictions. Grok 4.5 and Fable showed a wider mix of low and high correlations.
What information do the agents use to encode features?
Feature correlations show how similar features are, but not what market information they encode. We therefore review the features selected in the submitted models and assign each feature two qualitative scores:
- Price-based: How much the feature encodes price dynamics, such as price movements, reversals, and returns.
- Liquidity-based: How much the feature encodes trading activity and liquidity conditions, such as volume and trade flow.
These scores describe how a feature is constructed and interpreted, not its predictive power. We use them to group features into four broad families:
- Price Action — teal
- Flow & Liquidity — gold
- Price–Flow Interaction — rose
- Other — taupe
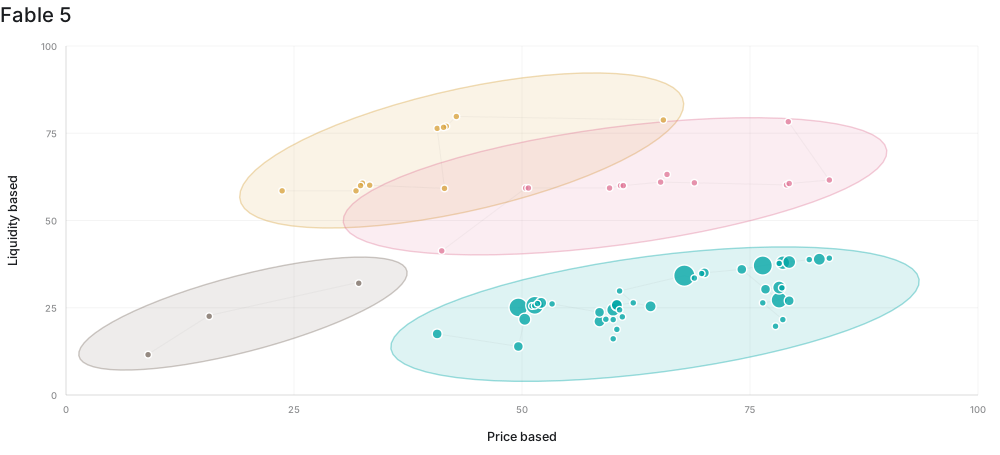
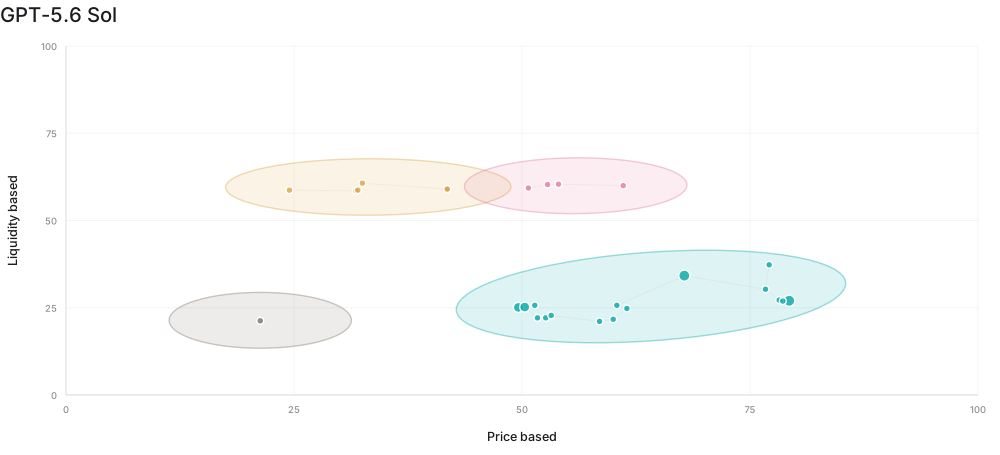
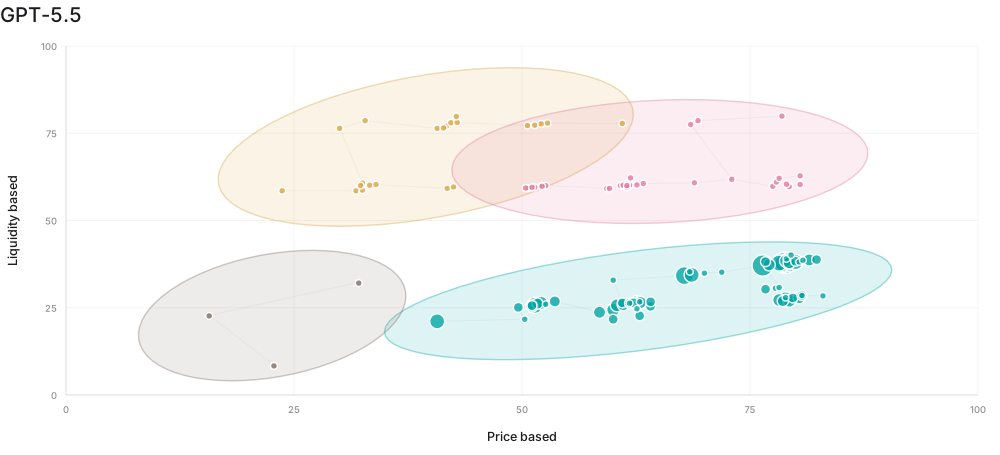
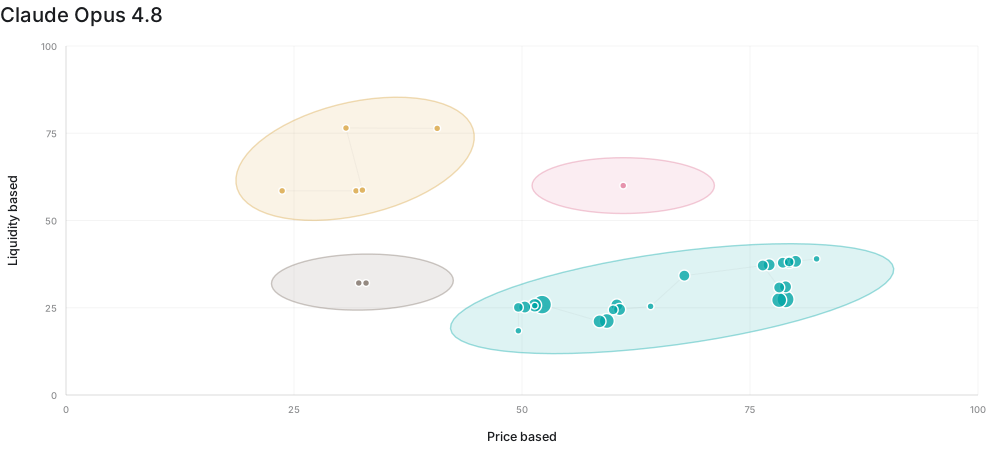
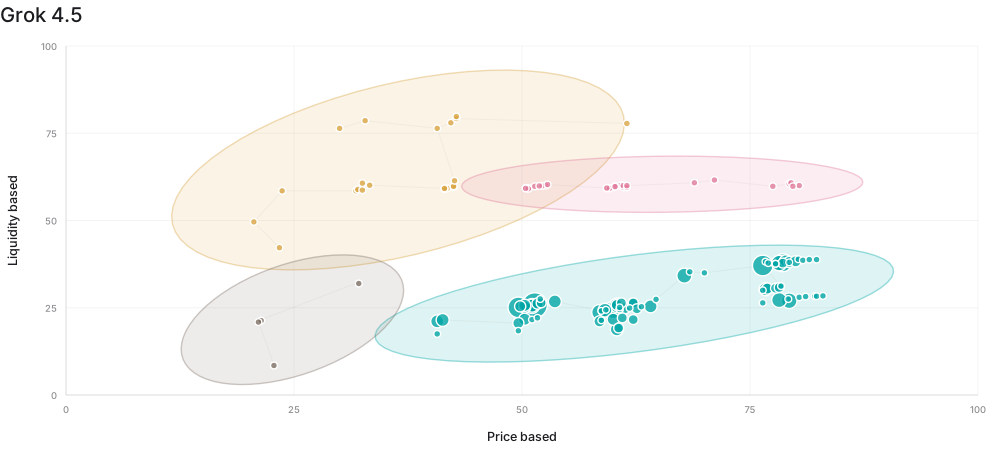
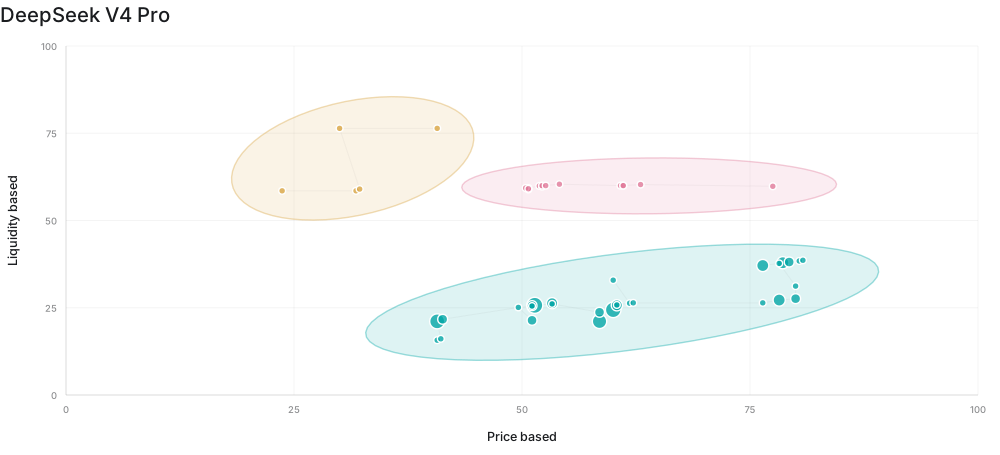
Each plot aggregates the final selected features across rollouts for one agent family. Coordinates are qualitative scores rather than fitted coefficients or measured correlations.
Price action and liquidity were the two dominant types of market information used to construct features. Although the overall distribution was broadly similar across model families, their emphasis differed. Fable 5, GPT-5.5, and Grok 4.5 covered price action, liquidity, and their interactions relatively broadly. Claude Opus 4.8, by contrast, focused only on price information.
Quality Assurance
1. Evaluation isolation
In all experiments, the out-of-sample evaluation dataset remains outside the agent environment for the entire rollout. It is used only for evaluation after the agent makes its final submission. The agent cannot use evaluation results to revise its submission.
2. No lookahead
We replace symbol names with generic identifiers, replace absolute dates with relative dates starting from January 1, 1980, and transform market return targets to prevent models from recalling market patterns from pretraining. During the rollouts, we observed no indication of lookahead bias in the traces.
3. Traceability and reproducibility
The submitted predictive models, fitted artifacts, strategy parameters, and predictions are preserved in the traces, along with every tool call and experiment. The evaluation results can be regenerated by following the traces step by step.