Benchmark
Long-Horizon Planning in Nonstationary Environments
Measuring model capabilities to maintain and revise strategies over hundreds of decisions
Most benchmarks test whether an agent knows what to do, rather than how to do a certain type of tasks. We need both abilities to evaluate genuine intelligence. Long-Horizon Planning is the first in a series of benchmarks built around that distinction.
Long-Horizon Planning evaluates agents in a 2 year market environment and measures its trading performance over this period. The environment provides the agent with pre-built tools for quantitative trading (agent has to choose tool parameters) and bash tools to implement it's own trading strategy. A trading strategy is any process that results in a (sequence of) trade(s). Operating in our environment measures the agent's long-horizon planning abilities because it consists of multiple sequential decisions with delayed rewards and tools with different quality across time.
Compared with existing long-horizon evaluations - Vending-Bench [1], -bench [2], and WebArena [3] - this benchmark provides the following improvements:
- Real-world nonstationarity: Trajectories follow noisy empirical multivariate distributions rather than a parametric simulator.
- Learning how, not just what: Agents must discover how to combine and tune tools online instead of learning one ideal procedure.
- Actions with delayed consequences: Some tool usage affects more than one step into the future, ie some forecaster tools provide forecasts for multiple horizons; multi horizon optimisers balance trade offs between current and later stage trades. Similarly, agents can submit trading strategies for multiple steps without adjusting parameters in between.
- Immediate and verifiable reward: Scores are based on portfolio performance and thus can be calculated immediately and automatically - without an LLM judge or human evaluation.
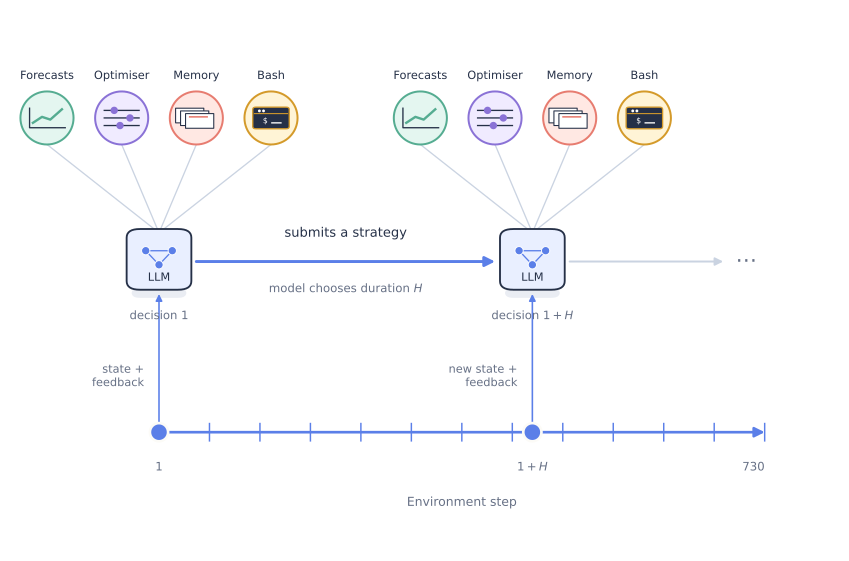 At each decision point, the model can use provided trading tools to build a strategy: choose forecasts, optimisers and submit this strategy for a chosen duration.
Leaderboard
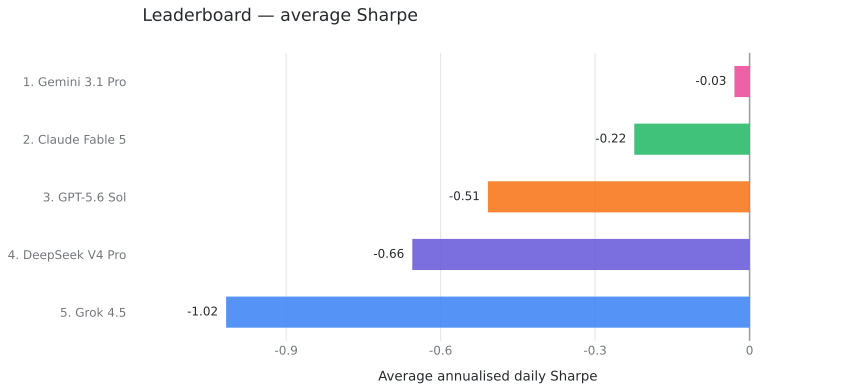
The leaderboard compares models on average PnL (final portfolio value less the initial $100,000), average annualised daily Sharpe, and average maximum drawdown. Each metric is calculated per rollout before averaging across the ten rollouts for a model.
Even though Gemini appears to lead all metrics, detailed analysis below show that in fact it is the model with largest variance in performance - selecting any 10 other runs would show a completely ranking. Similarly, judging by its tool use, it would not be considered a more useful model in trading than DeepSeek.
Methodology
Each environment episode replays a historical market trajectory over 730 daily steps, from January 2022 through December 2023. The agent starts with $100,000 and trades ten cryptocurrencies. At every step, it receives the current state, chooses an action, then receives a reward and the next state. An episode ends when the environment at the last time step returns the state end=True, agents ceasing to respond before will count as failed rollouts.
The agent may call pre-built tools or calculate actions directly in a model-written strategy. A typical tool-assisted workflow is to select forecasts, set risk and turnover constraints, call the optimiser for a target trade, then submit a strategy. Strategies may act for one step or for an agent-chosen horizon.
State and action space
| Category | Format |
|---|---|
| Forecasts | Per-symbol future-return vectors: one return for a single horizon and two for a two-horizon forecast. Provided directly in the environment state. |
| Recent empirical state | Recent symbol-price and trading-volume history |
| Current state | Current symbol prices, positions, and rewards |
| Episode progress | Current step and steps remaining |
| Recent history | Up to eight earlier actions, rewards, execution outcomes, and forecaster outcomes |
Each action specifies a desired dollar trade amount for each symbol. Actions are limited by available capital and incur a 0.02% transaction cost. Cash positions also incur a 4% annual holding cost.
Tools
The same tools are available throughout the episode, in order to use a tool the agent must provide choices for their parameters. In addition to bash tools from the harness, the environment has the following pre-built tools:
| Tool | What it does | Required input parameters |
|---|---|---|
| Risk estimation | Computes a diagonal risk matrix for the traded universe from an agent-chosen history window | Lookback-window length used to estimate return variances |
| Single-horizon optimiser | Converts a one-horizon forecast into a target action | Forecast, forecast scale, risk estimate, turnover penalty, maximum portfolio position change per step |
| Two-horizon optimiser | Converts two-horizon forecasts into target actions for each horizon | The single-horizon inputs, specified for both horizons |
| Memory and journal | Retrieves earlier steps and realised forecast correlations, and stores structured agent reflections | - |
| Strategy execution | Runs a model-written strategy over a chosen horizon | Strategy duration |
| Action submission | Executes signed actions and returns reward and the next state | Trading action |
Forecasts
The environment provides five forecasters of generic name for different forecasting horizons with changing quality over time:
| Forecaster | Target horizon | Properties |
|---|---|---|
| A | 1 step | Switches between useful and uninformative periods |
| B | 2 steps | Switches between useful, systematically wrong, and inactive periods |
| C | 1 step | Decays with a 150-day half-life |
| D | 2 steps | Decays with a 390-day half-life |
| E | 1 step | Contains no expected signal and acts as a negative control |
The agent does not see the hidden reliability schedule or future outcomes, but has tooling and access to past data to try and infer it.
Strategy submission
For each strategy, the model chooses a duration, update rules, and stopping rules. A strategy can therefore trade for several steps without revising its parameters between steps. We cap each strategy run at 100 steps, so no single strategy can cover the full episode.
Reward
The environment provides a reward vector containing cost-adjusted Sharpe (mean return normalised by return standard deviation) and total portfolio return over the full episode. These are the primary performance signals available to the model via the environment state. To study generalisable failure modes beyond this domain, we also measure how models choose tools and parameters, inspect their reasoning, and adapt to environmental changes.
Task construction
A task fixes the prompt, tools, scores, forecaster seed, and episode length. A benchmark contains multiple frozen tasks that vary in their selected cryptocurrencies, date ranges, and tool choices. Within each task, every model receives the same instances, prompt, tools, and number of trials.
Model harness
All models run through the same Kimi harness, chosen for its model-agnostic design. Each model receives the same task-specific system prompt and benchmark tools. It can perform numerical reasoning and calculations within its own strategy, and persist structured reflections in the benchmark journal; generic shell and workspace-file access are disabled in the primary comparison.
Quality assurance and information controls
- No lookahead. We replace symbol names with generic identifiers and remove absolute dates to prevent models from recalling market patterns from pretraining. The agent receives only relative time, such as “one step ahead”, and cannot access the source mapping, task configuration, or raw data files.
- Reproducibility. We verify that each instance can be regenerated, that the negative-control forecaster remains close to zero correlation, and that the trace records every strategy, tool call, action, reward, and stopping reason.
Results
Final scores
This subsection report measures of rollout behaviour across models and compares them with a deterministic reference run that always selects the forecaster with the highest true current correlation. Models cannot observe that correlation, so the reference is best interpreted as an approximate upper bound rather than a directly attainable baseline.
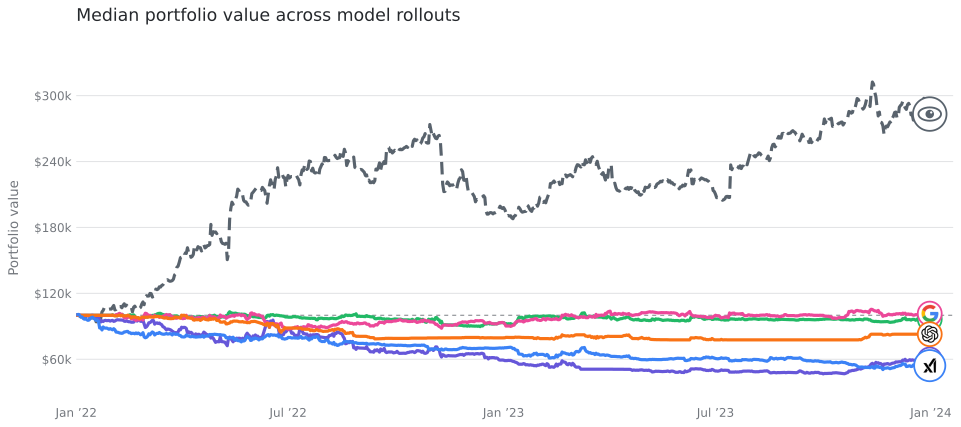 Model lines show daily medians across ten rollouts. Circular endpoints carry provider logos; the dashed charcoal trajectory is the deterministic reference, and the horizontal dashed line is the initial $100k portfolio value.
No model approaches the deterministic reference run over the full episode.
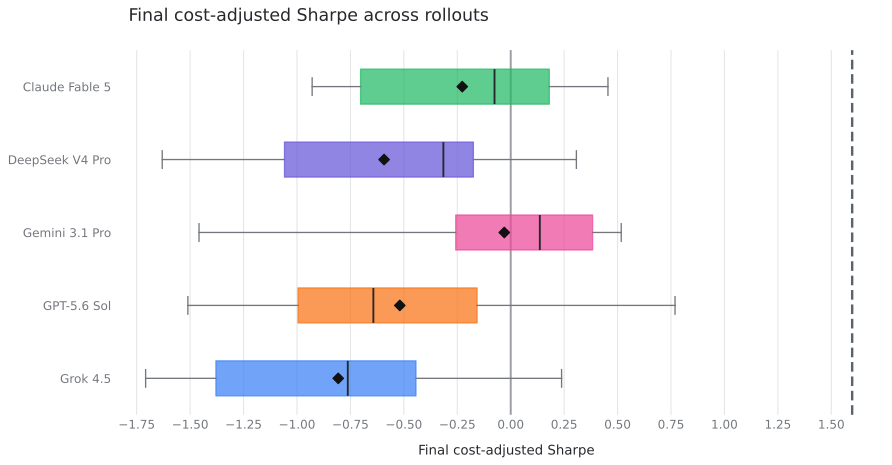 Boxes show IQR, whiskers show the observed range, and diamonds show means. The charcoal dashed line marks the deterministic reference Sharpe of 1.60.
GPT-5.6 Sol and Gemini show the widest Sharpe ranges, indicating substantial variation across rollouts. DeepSeek and Grok have lower central values, while Fable has the narrowest distribution.
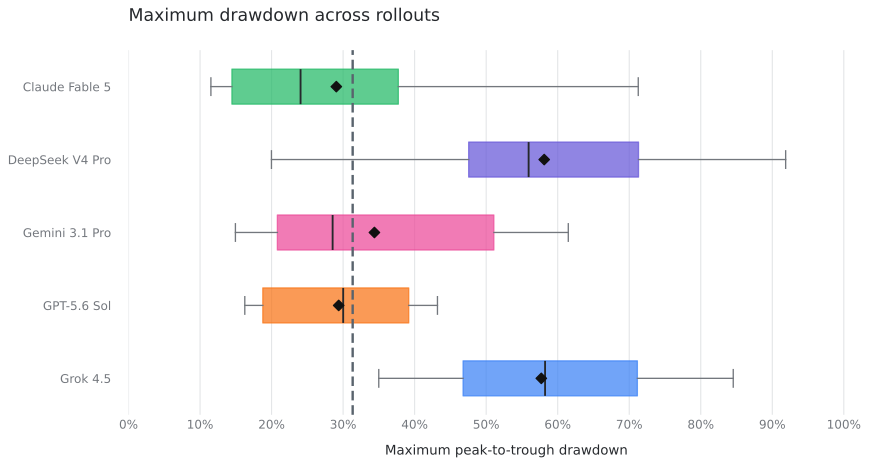 Maximum drawdown is the largest percentage decline from a preceding portfolio peak; lower is better. Boxes show IQR, whiskers show the observed range, diamonds show means, and the charcoal dashed line marks the deterministic reference maximum drawdown of 31.3%.
This is consistent with the Sharpe results: DeepSeek and Grok have the largest typical drawdowns, while a small number of Fable rollouts also experience comparatively deep losses.
Optimiser tool parameters
This section examines two optimiser parameters: the turnover penalty and the maximum portfolio position change per step, expressed as a percentage of current portfolio value. Agents can use these parameters to adjust the aggressiveness of a strategy as market conditions change - for example, by choosing tighter limits in a more volatile regime.
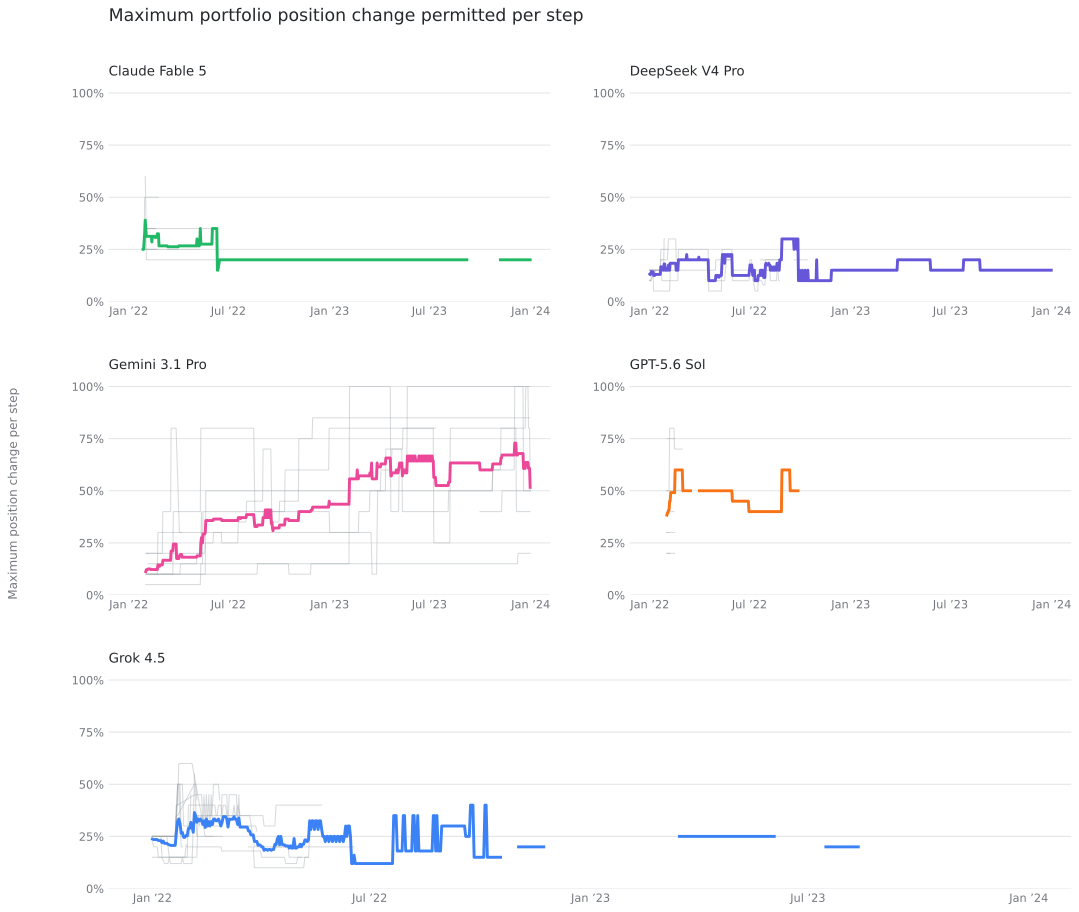 Grey traces are individual rollouts; the coloured trace is the mean on days when that model called the optimiser. Gaps indicate no optimiser call.
This parameter caps the sum of absolute changes from the current positions to the optimiser's target positions in one step. Smaller limits reduce both transaction costs and potential profits. For GPT-5.6 Sol and Fable, many active days come from a single rollout, so the coloured mean overlays the corresponding grey trace. DeepSeek generally stays between 10% and 30%, while Gemini calls the optimiser more persistently and chooses a larger, more variable position-change limit.
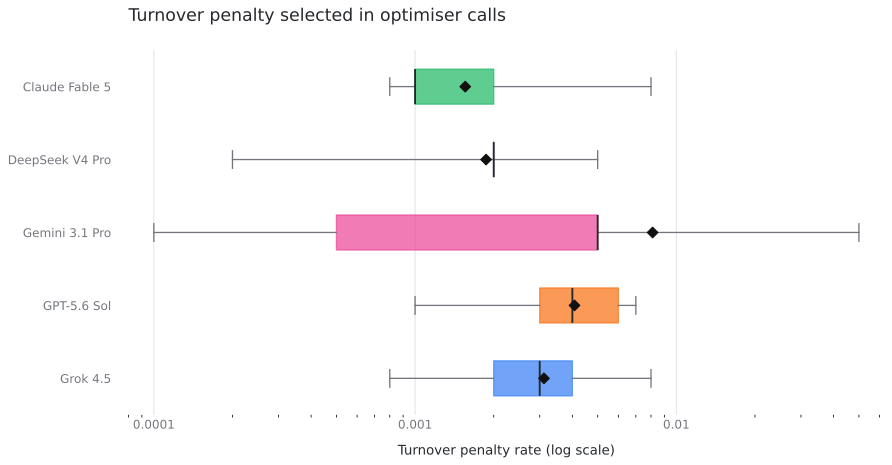 Boxes show IQR, whiskers show the observed range, and diamonds show means.
The agent chooses the turnover penalty when it calls the optimiser. This parameter sets the cost of changing positions during optimisation and therefore determines how much expected benefit a trade needs before the optimiser considers it worthwhile. Values that are too low encourage overtrading and unnecessary costs; values that are too high encourage undertrading and can make holding cash the preferred solution. The chosen penalties are at least an order of magnitude larger than the direct transaction-cost term, suggesting that they may contribute to undertrading.
Forecast selection and scaling
At every step, the agent receives multiple forecasts and may use any number of them - including none - to make its trading decision. Because forecast quality changes over time, the speed and quality of source changes reveal whether a model can inspect and adapt to tool performance. Agents may also choose multiple forecasts and blend them. After agents decide on one final forecast to use, they can further modify it by applying a scaling factor on top, this expresses the confidence and direction assigned to the signal.
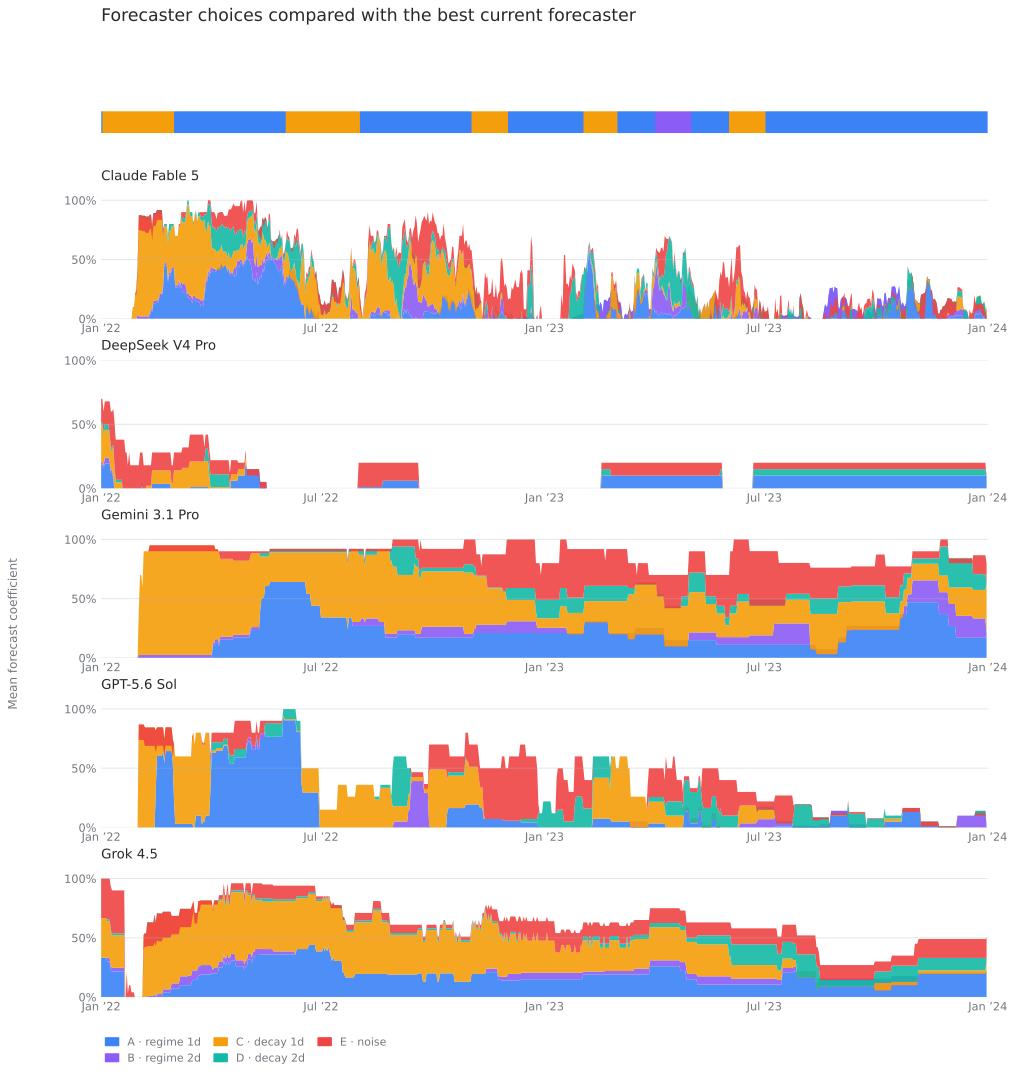 The top strip identifies the forecaster with the highest realised correlation on each day; the five panels show mean blending coefficients. Coefficients are not constrained to sum to 100%.
Most models retain a selected source for several steps before changing it, whereas Fable changes sources much more frequently. DeepSeek does not always use forecasts. Every model assigns some weight to the noisy negative-control forecaster during at least part of the episode.
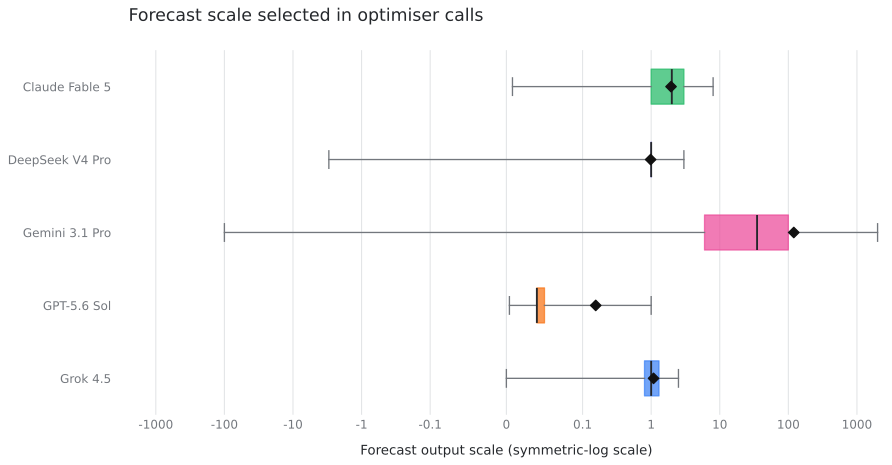 Forecast scale multiplies the submitted forecast after blending. Boxes show IQR, whiskers show the observed range, diamonds show means, and the symmetric-log axis keeps negative and large positive values visible.
All models except Gemini use a relatively consistent range of positive scales. Gemini also explores negative scales and typically selects values orders of magnitude larger. A negative scale can be valid: a reliably negatively correlated forecaster may contain useful signal once inverted.
Strategy submission duration
For each strategy - its chosen forecasts, scaling, risk settings, and optimiser configuration - the agent chooses how long to run without changing parameters. Short durations enable rapid adaptation but can over-index on recent noise; longer durations reduce intervention but risk persisting through a regime change.
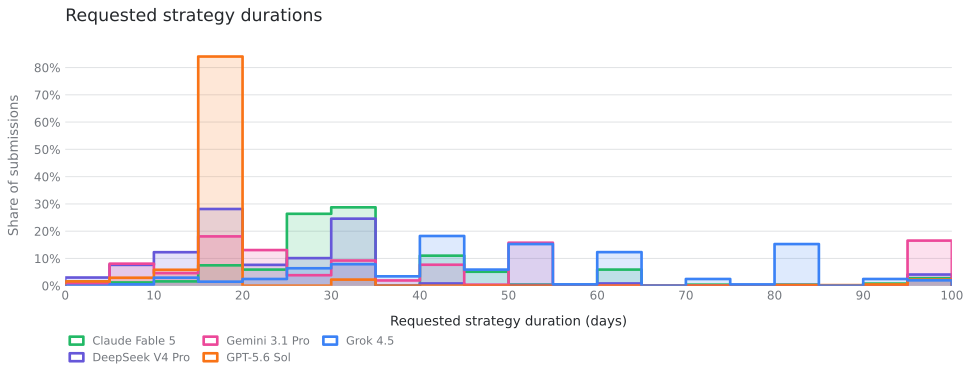 Each outline is a model’s distribution of requested strategy durations; translucent fills show where distributions overlap.
Gemini and Grok most often choose long durations, including many above 50 days. DeepSeek is concentrated around 15–30 days. In this market window, a 50-day commitment can span several regime changes, so long submissions may persist across several tool-quality regimes.
Qualitative analysis
Only Fable and Opus benefit from higher reasoning
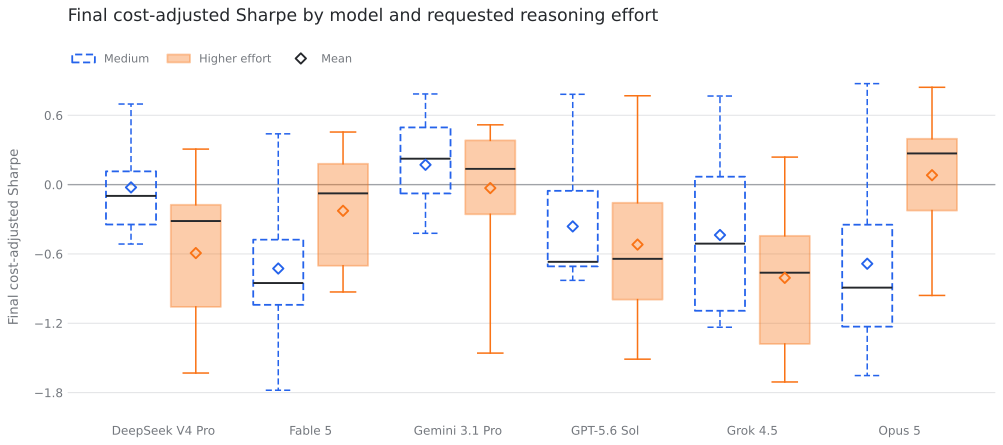 Each box contains ten rollouts. Boxes show IQR, whiskers show the observed range, and hollow diamonds show means.
Higher reasoning improves both the mean and median Sharpe for Fable and Opus. The other four models do not show a mean Sharpe improvement, with the largest deterioration for DeepSeek and Grok.
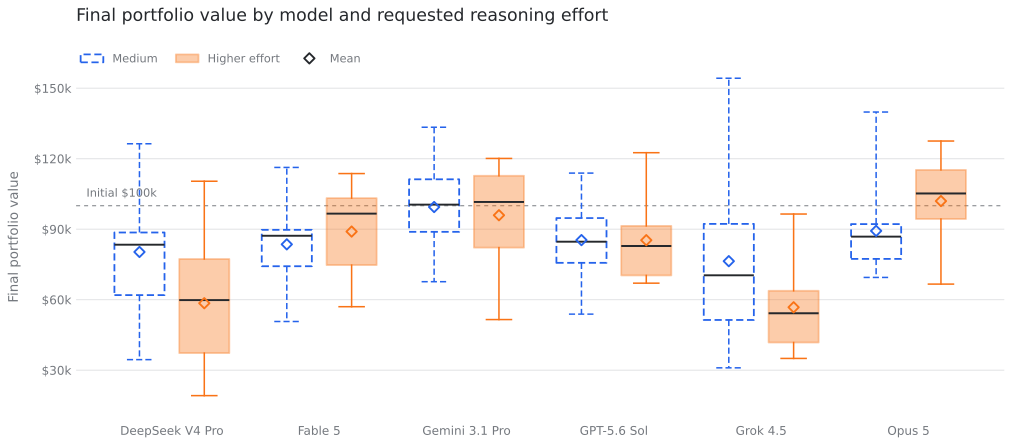 Each box contains ten rollouts. Boxes show IQR, whiskers show the observed range, hollow diamonds show means, and the dashed line marks the initial $100k portfolio value.
Higher reasoning increases both the mean and median final portfolio value for Opus and Fable. Gemini has a slightly higher median but a lower mean, while GPT-5.6 Sol is almost unchanged in mean and slightly lower in median. DeepSeek and Grok again deteriorate under higher reasoning.
Grok and DeepSeek trust forecasts immediately
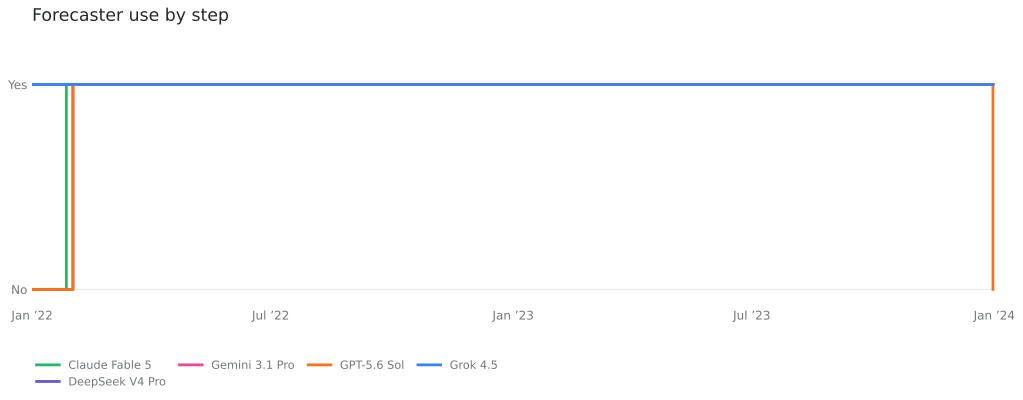 A model is marked “Yes” when at least one of its ten rollouts submitted a non-zero forecaster coefficient at that step.
At least one Grok and DeepSeek rollout submits a forecaster mixture from the first step. Fable, GPT-5.6 Sol, and Gemini instead begin with a forecast-free burn-in—typically until steps 26–40—while gathering realised reliability evidence. Immediate use is not necessarily wrong, but it commits capital before the agent has observed forecast performance in the current episode.
Fable & GPT adapt the fastest
For every change in forecast quality, we measure the amount of times that an agent stuck to the old model and did not adapt forecaster.
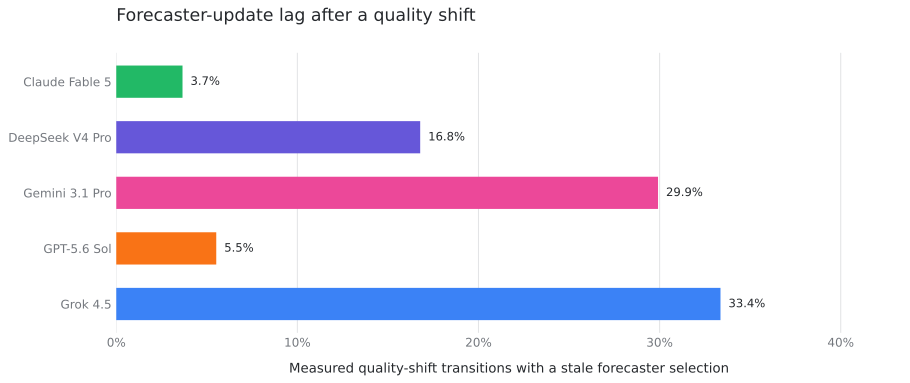 The lower this value, the less often a model clung to an old forecaster after the tool-quality regime changed.
GPT stops trading after losses, Gemini goes all in
We measure the change in the optimiser parameter for max. amount of portfolio to trade at different drawdowns. X-axis shows the drawdown amount the portfolio is in, y-axis shows the change in requested portfolio % to trade normalised to the traded amount at previous peak.
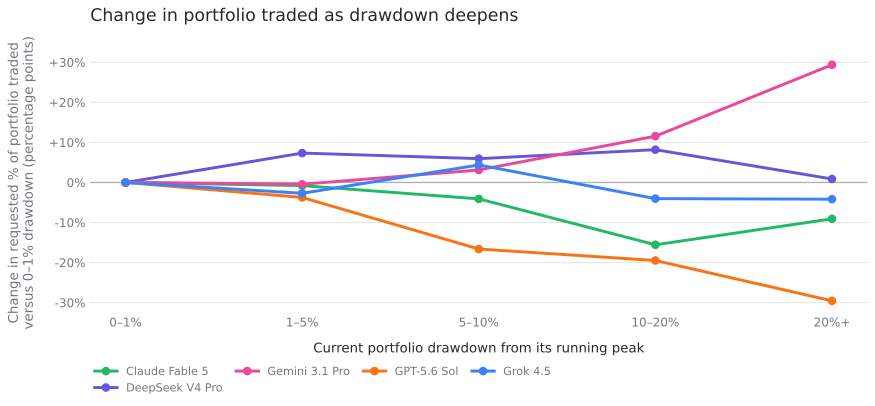 Positive values indicate that the agent traded more as its portfolio lost money; negative values indicate that it traded less.
The chart shows that across rollouts, GPT becomes more conservative as its portfolio loses money, while Gemini does the complete opposite and trades more the more it loses.
Grok, Gemini and DeepSeek inspect history least
We measure successful tool calls per model decision day: a day on which the model submits or replaces a strategy. Days while an earlier strategy runs are excluded from the denominator, so the ratio can exceed one.
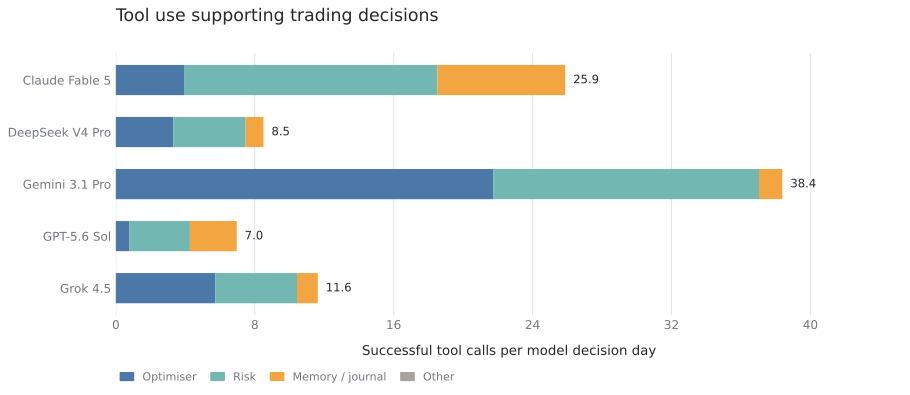 Each segment is the number of successful calls of that type per model decision day.
Risk estimators are called disproportionately more often than optimisers in the Fable and GPT runs, indicating that those models often inspect risk settings before submitting a strategy. Gemini and Grok use risk and optimiser tools in a more direct one-to-one pattern. DeepSeek calls fewer tools overall, and its memory or journal usage is similarly limited. These traces show less explicit inspection of past trades and forecaster performance, although they do not establish that tool-use frequency alone caused the performance difference.
Limitations
This benchmark tests one form of long-horizon planning in one sequential domain. The forecaster changes are controlled, while real distribution shifts are less clean. The task described in the blog supports an initial comparison, not a general claim about all planning tasks. The behavioural measures are also proxies, so we use them to find trajectories for inspection rather than as final judgements.
References
[1] Axel Backlund and Lukas Petersson. Vending-Bench: A Benchmark for Long-Term Coherence of Autonomous Agents, 2025.
[2] Shunyu Yao, Noah Shinn, Pedram Razavi, and Karthik Narasimhan. -bench: A Benchmark for Tool-Agent-User Interaction in Real-World Domains, 2024.
[3] Shuyan Zhou et al. WebArena: A Realistic Web Environment for Building Autonomous Agents, 2023.